


Market Summary: 1Q–2023
Fed’s Hiking Trip Comes to a Fork in the Road
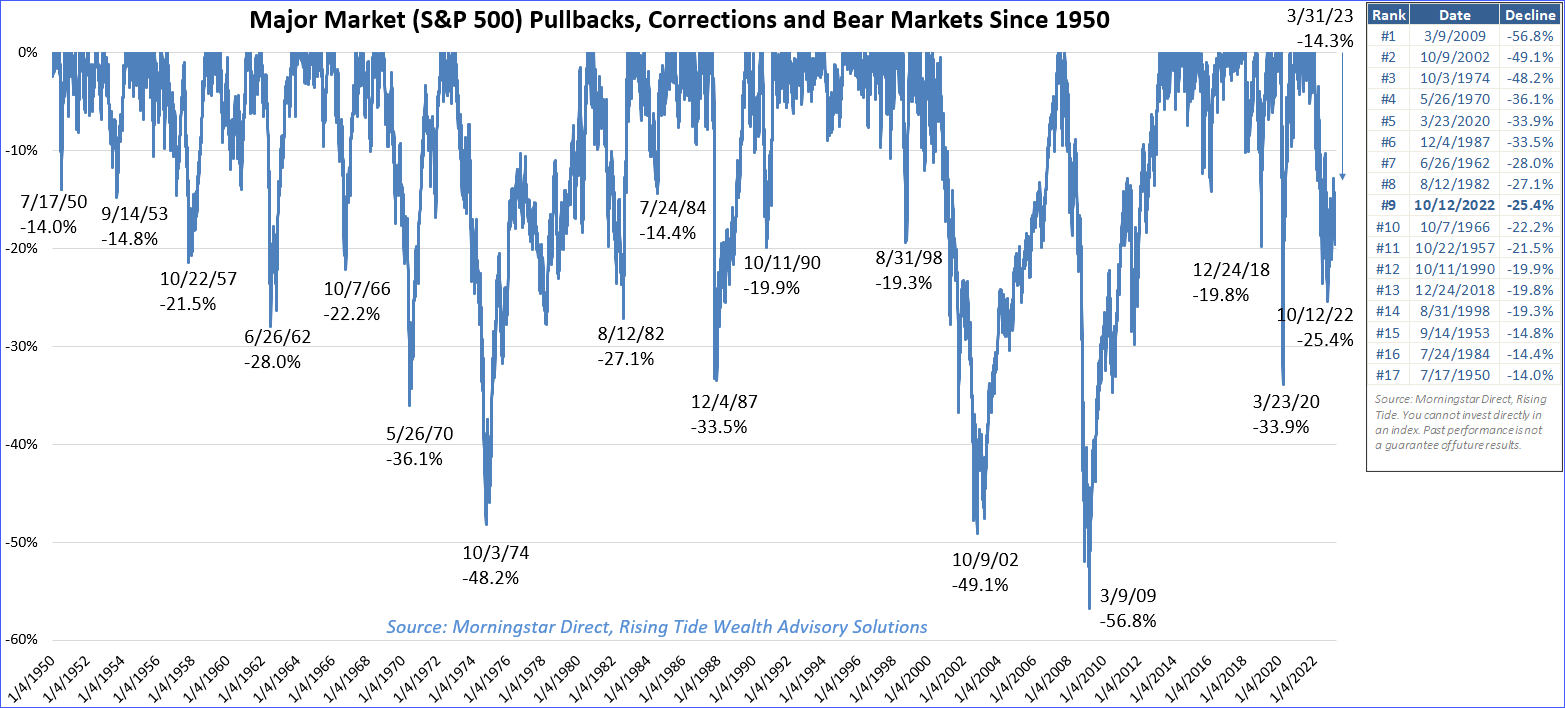
Global stocks had a great start to the year, extending a move higher that began following the October 12th low, at which point the S&P 500 was down 25.4% from its high ten months earlier. U.S. large cap stocks1 finished the first quarter +7.5%, while mid cap stocks2 were +4.1% and small cap stocks3 were +2.7%. Since the beginning of the year, growth stocks4 have outperformed value stocks5 (+14.4% vs. +1.0%, respectively). International developed market stocks6 exhibited similar returns for the year, +8.6%, while emerging market stocks7 were +4.0%.
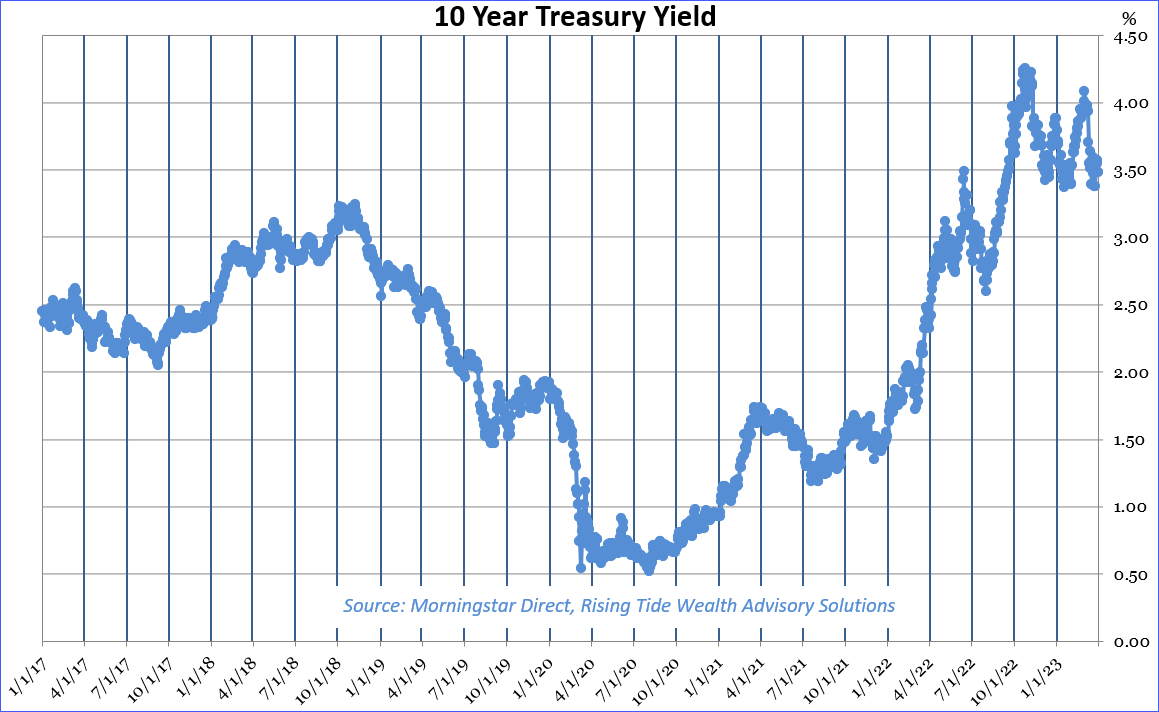
Interest rates have been moving steadily higher since mid-2020 (see below). At its low, the 10-year treasury yield was 0.52%, climbed as high as 4.25%, and now sits at 3.48%. The move higher began with optimism about a potential end to the pandemic, then accelerated as it became apparent that inflationary pressures were not easing on their own, as many economists originally thought, and the Federal Reserve (Fed) would need to hike interest rates.
The purpose for hiking interest rates is to slow down the growth rate of the economy. When rates rise, it increases the cost of borrowing for banks, which in turn increases interest rates they must charge their customers to borrow money. This elevates expenses for businesses and consumers, causing them to be more judicious with their spending, resulting in reduced consumer spending, which causes lower corporate profits, leading to layoffs, ultimately pushing the unemployment rate higher. As layoffs increase, recession fears rise and consumers tighten their spending, which exacerbates the feedback loop. This is called aggregate demand destruction, and it is what the Fed means when they say there will be “some pain to households and businesses”.
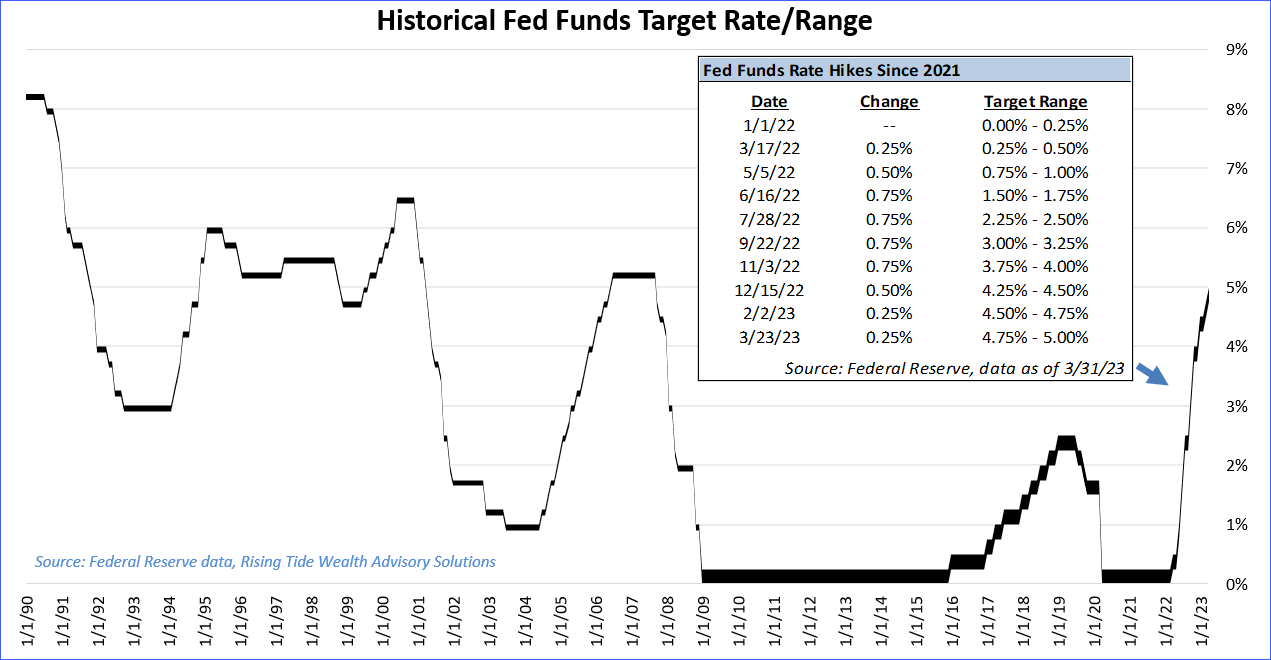
After the Fed embarked on their interest rate hiking journey in March of 2022 (see chart below), the market began to worry the aggressive pace of the moves might have negative repercussions in the global economy, particularly in international markets. You see, when US interest rates rise faster than foreign rates, our bonds have higher yields, drawing foreign investment into US bonds. For that, foreign investors must convert their currency into US dollars, which causes the value of the dollar to rise. And when the dollar rises, it can cause problems for foreign borrowers who issued debt in US dollar terms, because now their debt payments are rising in value (i.e., they have to trade in more of their own currency to buy dollars to make their debt payments). Currency gyrations have contributed to emerging market debt defaults in the past, so naturally, analysts feared a repeat of history. Fortunately, most emerging market economies are in better fiscal positions now and use more currency hedges than in the past.
While market watchers’ sights were focused overseas, trouble was brewing right beneath our feet. As rates moved higher, Bitcoin and other cryptocurrency losses accelerated from the highs achieved in late 2021. Subsequently, several high-profile crypto exchanges, lenders, and investors collapsed in 2022, causing ripple effects for their counterparties. Eventually, two traditional banks guilty of leaning too far into the high-risk, high-reward nature of the crypto world (Silvergate Bank and Signature Bank) also fell victim.
What was most surprising to many was the collapse of Silicon Valley Bank (SVB). This wasn’t a case of betting too much on crypto, but instead appears to be a story of just plain old poor banking risk management. “Financial Intermediaries 101” class in graduate school taught the importance of 1) diversification of depositor base and 2) interest rate immunization for lenders. Apparently, the SVB management team never took that class. The bank had large deposits above FDIC-insured limits with a fairly concentrated clientele - venture capital (VC) firms in Silicon Valley. As interest rates climbed, VC firms faced with a slowing economic environment, higher cost of borrowing, and declining valuations began to prepare for a storm.
The second mistake for SVB was a mismanagement of the bank’s interest rate risk on their balance sheet. This can generally be accomplished by either hedging using derivatives (e.g., interest rate swaps), or by following a process known as asset-liability matching (ALM), where the bank invests its assets (loans and investments) to match the same duration as its liabilities (deposits). SVB did neither. The bank was over-allocated to long-term bonds, and (because when interest rates rise, the value of bonds fall) the upward pressure on rates by the Fed caused a significant impairment in the bank’s assets, and by virtue, their total balance sheet. As word spread among VC firms that SVB might be in trouble, it triggered a bank run, and ultimately its demise.
News of the three bank failures over two weeks in early March created worries of a domino effect of more bank runs. However, concurrent with the collapse of SVB, the Federal Reserve, the Treasury, and the FDIC announced joint efforts to shore up the banking system and allow any bank to pledge their Treasury bonds at par with the Fed if necessary. Now that the dust has largely settled, the postmortem looks as though those three banks had issues that were specific to them, and not widespread among the rest of the banking system. The rule change seems to have stemmed the tide of panic in the banking system, but not without a lot of political bickering and finger pointing that might cause the debt ceiling debate later this summer to be more contentious. Hopefully lenders, borrowers, regulators and investors have learned something valuable from the episode.
The Economic Picture: Jobs, Inflation, Consumer, Housing, and Manufacturing
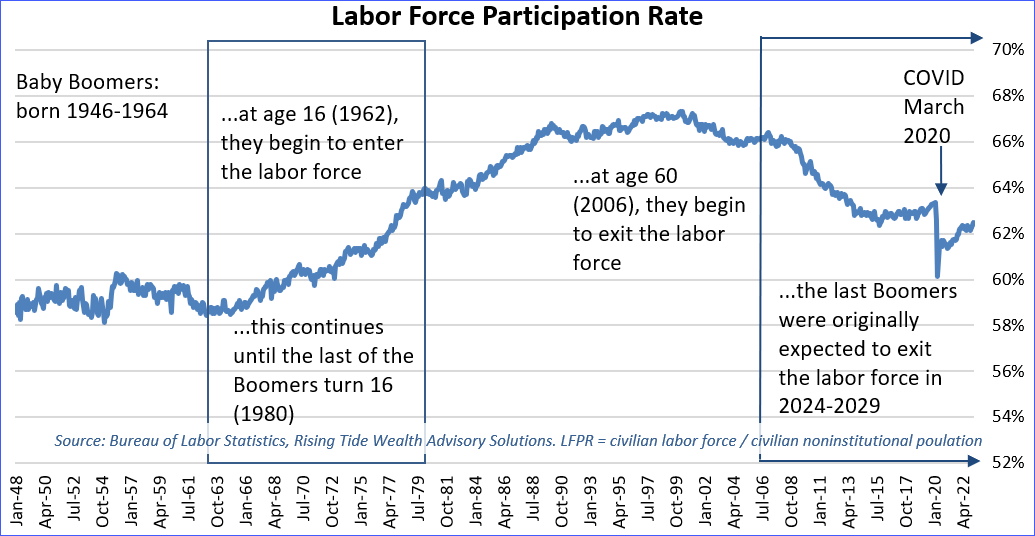
Beyond the mid-March panic, the economy appears to be in relatively good shape, albeit one that is showing signs of cooling. The job market looks strong, with the unemployment rate still near historic lows - largely a result of the tight labor market following the pandemic when many working Americans at or near retirement decided to fully retire. But recently, whether it’s due to inflation eating into retiree’s savings or higher wage prices attracting more participants, more people are re-entering the labor force, as evidenced by a rising labor force participation rate (see below). This should help keep a lid on wage inflation in the future, but may also create slack in the labor market, enabling further corporate layoffs in coming quarters.
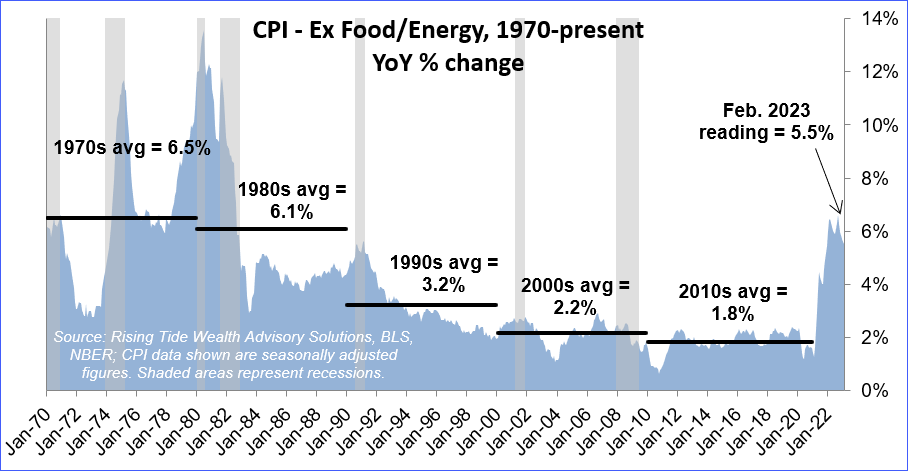
Inflation remains stubbornly high, but is trending in the right direction. The overall Consumer Price Index (CPI) reached a peak of +8.8% on a year-over-year (YoY) basis in June 2022, but has eased to +6.0%. After excluding the more volatile food and energy components of the CPI figure, this “Core CPI” figure (see below) peaked at +6.6% in March 2022, and is now +5.5%. So, inflation readings seem to be heading in the right direction, but are still far from the Fed’s 2% goal. It will be interesting to see whether the Fed holds to that target, because some of the longer-term secular drivers of lower inflation (e.g., globalization) appear to be in the rearview mirror. As we nearshore production closer to America, sure transportation costs and geopolitical risks fall, but labor costs rise. Hence, we may be in a period of persistently higher inflation than what the Fed wants, and if they stick to their 2% target, it might come at the expense of pushing the American economy into a deeper recession.
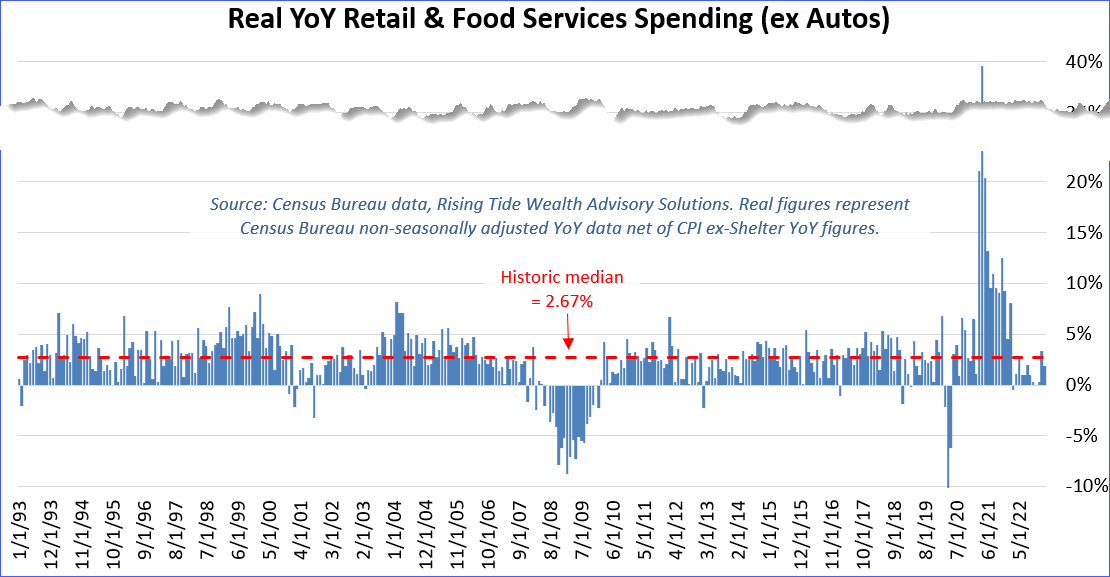
On the surface, consumer spending appears to be strong, with retail sales figures still in the +5% YoY range – about in-line with the historical average growth rate. That said, some of that spending is being driven higher by inflation (as noted above). After adjusting for the impact of inflation, “real retail sales” (+1.9% YoY in February) have been lower than their long-term average (of +2.6%) for 10 of the last 12 months.
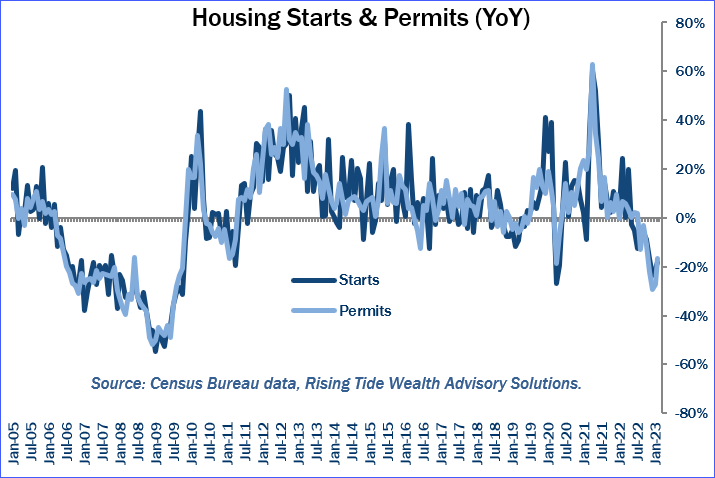
Following a peak in the Spring of 2022, home price gains have decelerated considerably. The January reading of the Case-Shiller National Home Price Index showed a YoY gain of 3.8% compared to +20.8% at its peak just 10 months ago. Much of the reason for the cooling in home prices is attributed to the rise in interest rates that saw 30-year fixed rate mortgages rise from ~3% in late 2021 to over 7% in November 2022. In turn, the cooling of increases in residential prices led to a large drop in housing starts and permits (i.e., homebuilding activity) YoY.
Lastly, conditions in the US manufacturing sector have been weakening since last summer, with the S&P Global US Purchasing Managers Index (PMI) registering a March reading of 49.2 (less than 50 indicates a decline from the prior month). Generally, this is in-line with the rest of the world. Most European economies are showing contractions, while Asian countries are mostly split with developed market economies showing declines and emerging market countries showing growth.
In Conclusion
The rally that fueled first quarter gains has pushed large cap growth stocks back into “expensive” territory from a valuation perspective. That could signal the new beginning of a bull market if (as the market seems to be predicting) the Fed is nearly done with rate hikes. However, if (as the Fed predicts) there are more rate hikes ahead, the rally may prove to be a head fake preceding more turbulence. It will be interesting to see which path the Fed chooses going forward. It’s important to keep in mind that monetary policy effects typically show up on a 6-to-24-month lag, which may be why some cracks are beginning to appear. Furthermore, the combined effects of monetary tightening (e.g., higher rates, plus the Fed attempting to shrink its balance sheet) and now tighter bank lending (following SVB) may have a more acute effect on the economy going forward.
It's difficult to say where the markets go from here. We find ourselves seemingly somewhere along the path between a tight monetary policy regime and a possible recession - whether it’s a mild, moderate, or severe recession is still the subject of much debate - with plenty of potential risks on the horizon (e.g., escalation of war and the debt ceiling debate). Furthermore, whether we are in the early innings or late innings of that transition, we may not know for a while, but the hazy outlook calls for maintaining discipline, ensuring allocations are consistent with both investors’ goals and risk tolerance, and ensuring portfolios are optimally (including tax-optimally) diversified among volatility-reducing assets.
In the meantime, the market seems set to rise with any indication the Fed might be near the end of rate hikes (e.g., lower inflation figures or signs of a slowing economy), and set to fall when it appears the Fed will continue to hike rates. The last quarter has demonstrated the importance of risk management and diversification. Investors’ collaboration with advisors is key to ensure that client funds are appropriately allocated within insured limits. There are several options available for earning healthy insured returns right now. If you are unsure about those solutions, let’s talk. At Rising Tide, we take a 360-degree view of portfolios to mitigate multiple different risks in the current environment.
---------------------------------------------------------------------------------------------------------------------------------------------------