


Market Summary 2Q-2023
Recession No-Show?
The second quarter began with continued unease in the US financial system following bank runs in early March that had some concerned it could be the catalyst that finally tipped us into recession. As the crisis appeared better-contained, investors turned their attention to the looming June 1st debt ceiling expiration. A spending deal was reached in the eleventh hour to kick the can down the road and extend the country’s ability to remain operational, but long-term fiscal reforms remain necessary to deal with the national debt. Late in the quarter, the world was on high alert as an armed revolt in Russia posed the greatest challenge to Vladimir Putin’s rule since he came to power in 2000. It was an interesting and worrisome quarter to say the least!
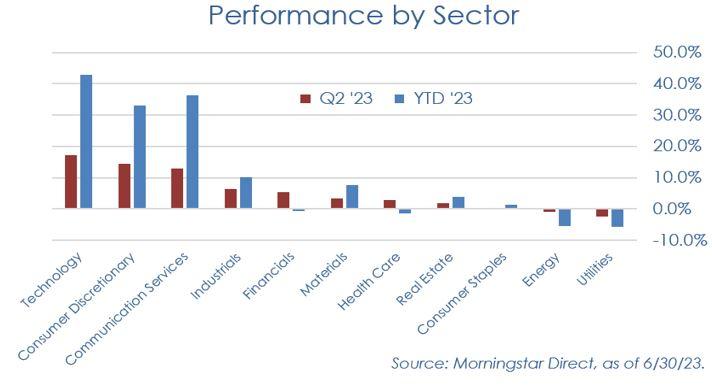
Despite all the worries, global stock markets were up across the board, with US large cap stocks1 finishing the quarter +8.7%, and registering a year-to-date total of +16.9%. Although the S&P 500 remains 7.2% below its January 2022 peak, the strength in the quarter propelled the index 24.4% above its October 2022 low, sparking a debate over whether we are truly in a new bull market (defined as “greater than 20% off the bottom”) or just a bear market rally. The bull market skeptics argue that the rally has been too narrow, with most of the advance attributable to just three of the eleven S&P sectors: Tech, Communication Services, and Consumer Discretionary. Beyond those sectors, the rest of the market hasn’t participated to the same degree.
Peering deeper into the US market, we see that growth stocks2 outperformed value stocks3 for the second quarter in a row (+12.8% vs +4.1%, respectively), and small cap stocks4 also performed well (+5.2%). Beyond the US, international developed market stocks5 were +3.2%, and emerging market stocks6 +1.0%.
Interest rates had generally been on a steady rise since the end of the pandemic, with the rate on the 10-year Treasury bond ascending from an August 2020 bottom of 0.52% to a peak of 4.25% in October 2022. The bank failures in early March resulted in a flight to safe haven assets which knocked rates back down to 3.30% (recall, when bond prices rise, their yields fall). Once the dust had settled, and it seemed there were no longer imminent threats to the banking system, rates resumed their climb higher, helped by Fed officials’ comments that further rate hikes were likely in store for the future.
Because shorter-term interest rates (e.g., 2-year Treasuries) are more responsive to Federal Reserve rate policy, they have risen more than longer-term rates, causing a “yield curve inversion” (where short-term rates are higher than long-term rates). Historically this has been a bad omen that precedes recessions, although it is not a perfect signal. The implication is that because longer-term rates are the product of all short-term rates, when the yield curve is inverted, it means the market expects rates to fall in the future. Falling rates typically only happen when the economy transitions toward recession, as investors sell stocks to buy safe-haven bonds (driving bond yields lower), and the Fed lowers rates to resuscitate a flailing economy. Hence, the bond market appears to be pricing in a recession, or at least some form of economic slowdown that will take rates lower in the future.
Investors find themselves in a market that seems stuck between cautiously optimistic and skeptically pessimistic. The skeptics point out 1) the market isn’t “cheap”, 2) impacts from Fed rate hikes show up on a long lag, 3) the yield curve is extremely inverted, and 4) bank failures from earlier this year will likely further tighten access to credit, intensifying a potential downturn.
However, despite all the concerns, it’s important to remember markets often “climb a wall of worry” – a phrase used by pundits to describe the tendency for markets to look beyond near-term troubles and move higher during periods when the consensus view is pessimistic. That said, recent corporate profit news has been optimistic. According to S&P Dow Jones Indices, the most recent earnings season showed year-over-year growth in corporate earnings for the first time in three quarters. Furthermore, a recent note from Factset7 highlighted the percentage of companies issuing positive (i.e., better than consensus estimates) earnings guidance for Q2 is on the rise and in-line with the average over the last 5 years.
There are several cross currents playing out across the global economy. The economic data is mixed, with some data pointing in a positive direction, and other data pointing to a slowdown in economic activity. The Fed has warned of further rate hikes and still expects a recession this year, though they believe such a downturn will be “neither deep nor prolonged.” The markets seem to be bouncing back and forth, trying to determine if they are ready to break out to the upside, or preparing for a downturn.
The best prescription for an indecisive market is to stay balanced, select higher-quality and less expensive investments, and avoid chasing performance. Remember that timing the market is a fool’s errand - markets don’t ring a bell at the top or the bottom. Even if you are able to avoid a drawdown, the next hardest decision becomes when to get back in. Investors should use this time to re-examine risk tolerance, make sure they are optimally diversified, and be ready to use any potential volatility to their advantage. If you are unsure about how to employ any of those strategies, let’s talk. At Rising Tide, we take a deep scan of investor portfolios to assess exposure to multiple risks and opportunities over different environments to better position investors for how the future may unfold.
Disclosures:
-
S&P 500 Index (total return, which includes both price returns and dividends)
-
Russell 1000 Growth Index (total return, which includes both price returns and dividends)
-
Russell 1000 Value Index (total return, which includes both price returns and dividends)
-
Russell 2000 Index (total return, which includes both price returns and dividends)
-
MSCI EAFE (Europe, Asia, Far East) Index (gross return, in US dollars)
-
MSCI Emerging Market Index (gross return, in US dollars)
-
https://insight.factset.com/highest-number-of-sp-500-companies-issuing-positive-eps-guidance-since-q3-2021